In this article:
- Accessing the Dashboards
- Understanding the Heat Map Dashboard
- Understanding the Time Overview Dashboard
- Understanding the Cash Flow Dashboard
- Understanding the File Dashboard
- Understanding the Transaction Reminders Dashboard
- Allowing or Limiting User Access to Dashboards
Dashboards in Legal Accounting provide a quick, visual summary of your firm’s productivity and financial performance.
They allow users to monitor fee earner productivity, time tracking and billing activity, cash flow and bank balances, file financial summaries and upcoming transaction reminders
Dashboards are designed to give firms key insights at a glance without needing to navigate multiple reports.
Accessing the Dashboards
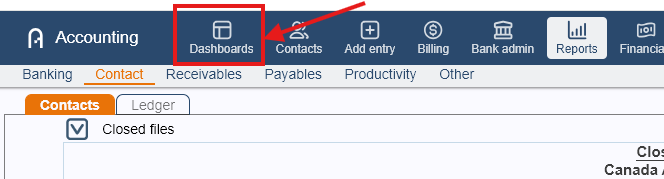
To open the Dashboards:
From the menu back. click the Dashboards icon.
Switch between tabs to access each dashboard.
By default, Legal Accounting includes five dashboards:
Heat Map
Time Overview
Cash Flow
File
Transaction Reminders
If you do not see all five dashboards, it may be due to user security restrictions. Contact your system administrator to confirm your access permissions.
Understanding the Heat Map Dashboard
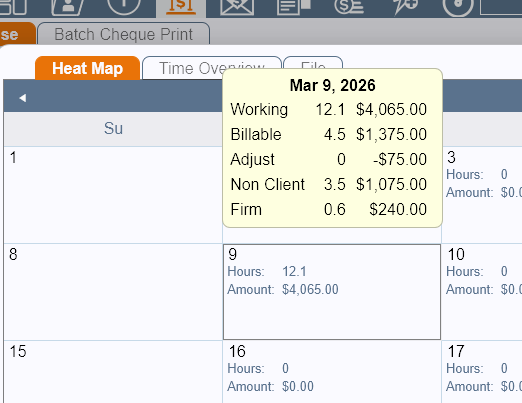
- The Heat Map dashboard provides a calendar-style overview of time entries and fee amounts recorded by each fee earner.
It displays:
Working - Entered and saved as Working under Time/Fees.
Billable - Entered and saved as Billable under Time/Fees.
Adjust- Includes adjustments made at the time of billing, after the invoice was finalized though adjust invoice or time entries with any task code under Adjustment task category
Non Client - Includes time entries with task marked as NBW (non-billable), NC (no charge) or any other that task category is set to Non-billable Client
Firm - Entries with task as Firm, not attached to any file or client.
- The Heat Map also displays a glance of days worked in a month and in a year.
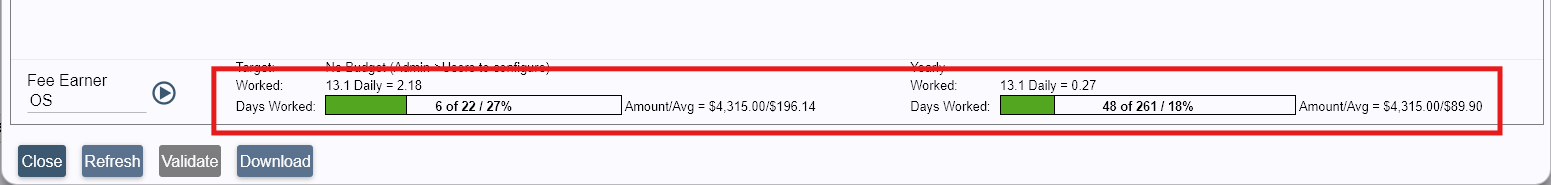
- Heat Map can also display the goal status and progress if the budget has been set and allows you to get a quick view on it via color-coded calendar display.
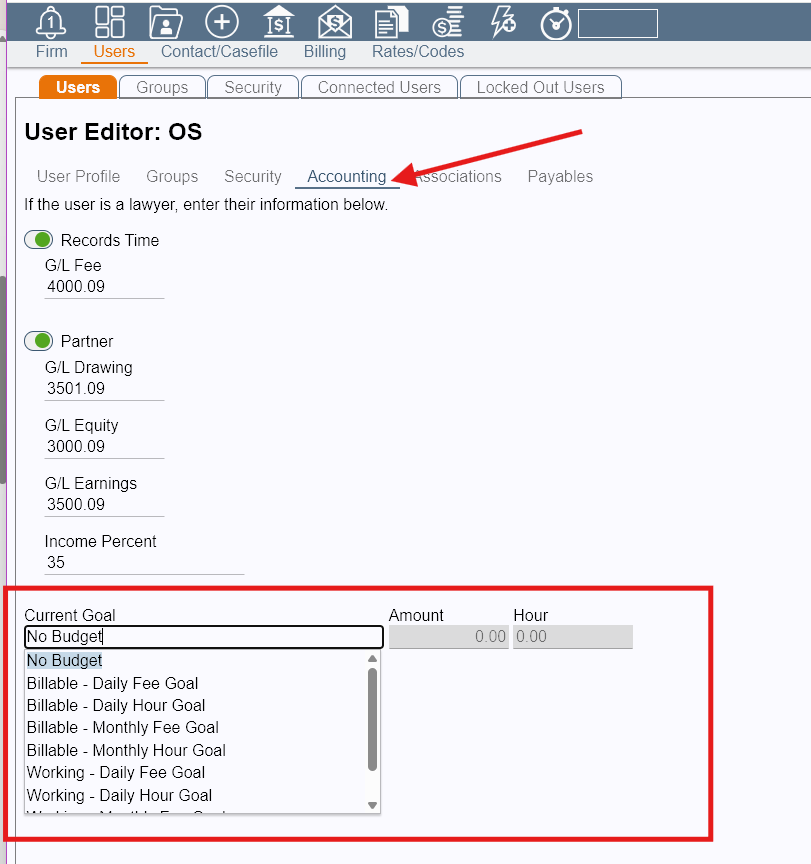
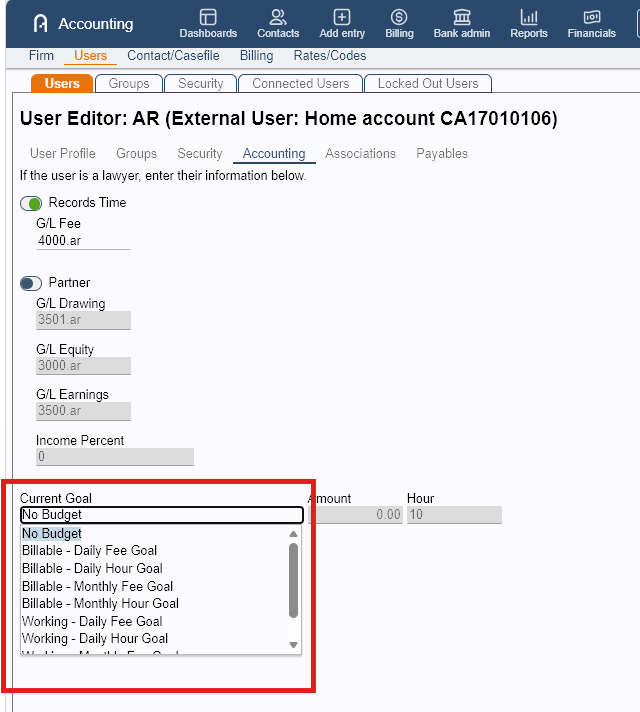
To set the budget, follow these steps:- Go to Admin > Users > Users tab.
- Click the pen icon next to the fee earner you need to set it up for.
- Go to the Accounting submenu.
- Under the Current Goal section, select the preferred goal from the list:
- Billable - Daily Fee Goal
- Billable - Daily Hour Goal
- Billable - Monthly Fee Goal
- Billable - Monthly Hour Goal
- Working- Daily Fee Goal
- Working- Daily Hour Goal
- Working- Monthly Fee Goal
- Working - Monthly Hour Goal
- Set the Amount or Hour for your selected goal
- Click Save.
- Do this for each type of work you want to set budget for (Billable and Working).
Heat Map Color Indicators
If goals are configured, the dashboard will display the following color indicators:
- Solid Pink - Days in which a user has not met their set goal(s)
- Pink and White Stripes - Days in which the user is within 10% of meeting their set goal.
- No Color - Days that the user met or exceeded their goal.
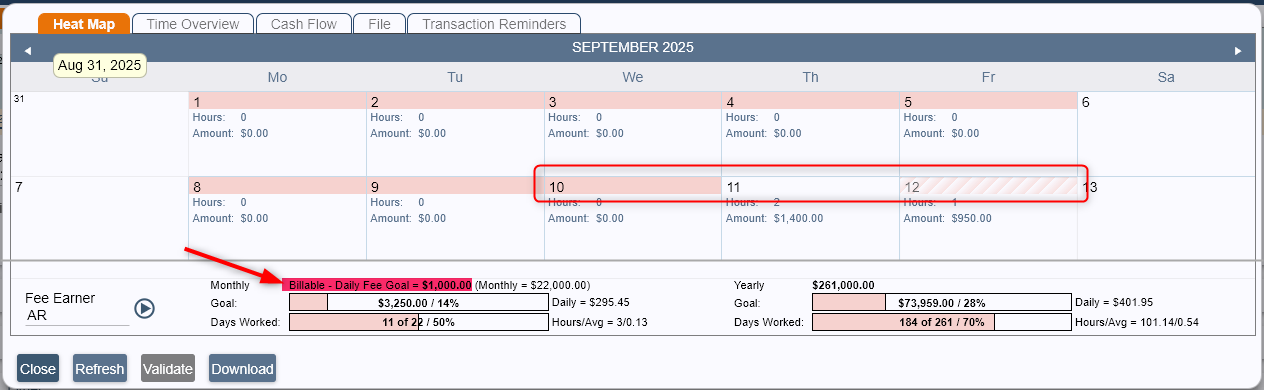
This makes it easy for firms to identify productivity trends across the calendar.
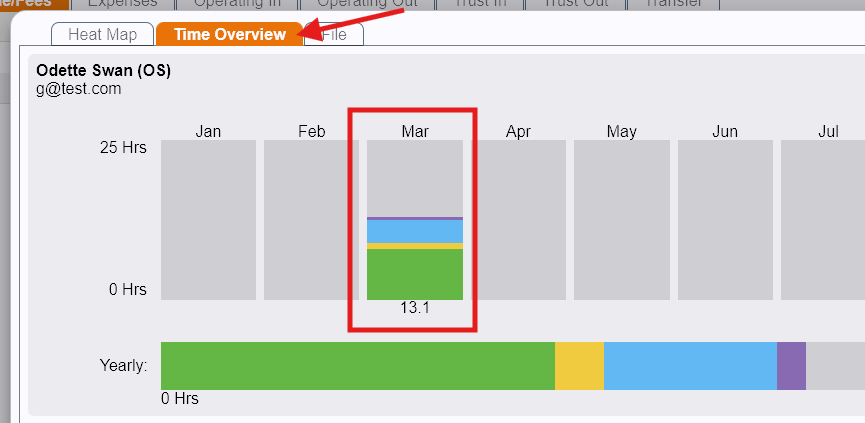
Understanding the Time Overview Dashboard
The Time Overview shows a monthly view Firm Summary totals for hours and amount entered for each month by task.
In the Firm Summary, both Fee (Amount) and Hours are displayed. However, for individual fee earners, the Time Overview will only display values based on the budget type set for that user:
No Budget or Hour budget type → Only hours will appear.
Fee (Amount) budget type → Only the amount will appear.
If you hover the mouse over the bar, you will see an indicator of the task type of hours displayed, defined as follows:
- Green - Billable Work
- Yellow - Adjustment
- Blue - Non-Billable Work
- Purple - Firm
 NOTE: To see which Task Category as Task is under, go to Admin > Rates/Codes > Task Codes and review the Task Category column of the list of tasks.
This dashboard helps track how time is being recorded and categorized across the firm.
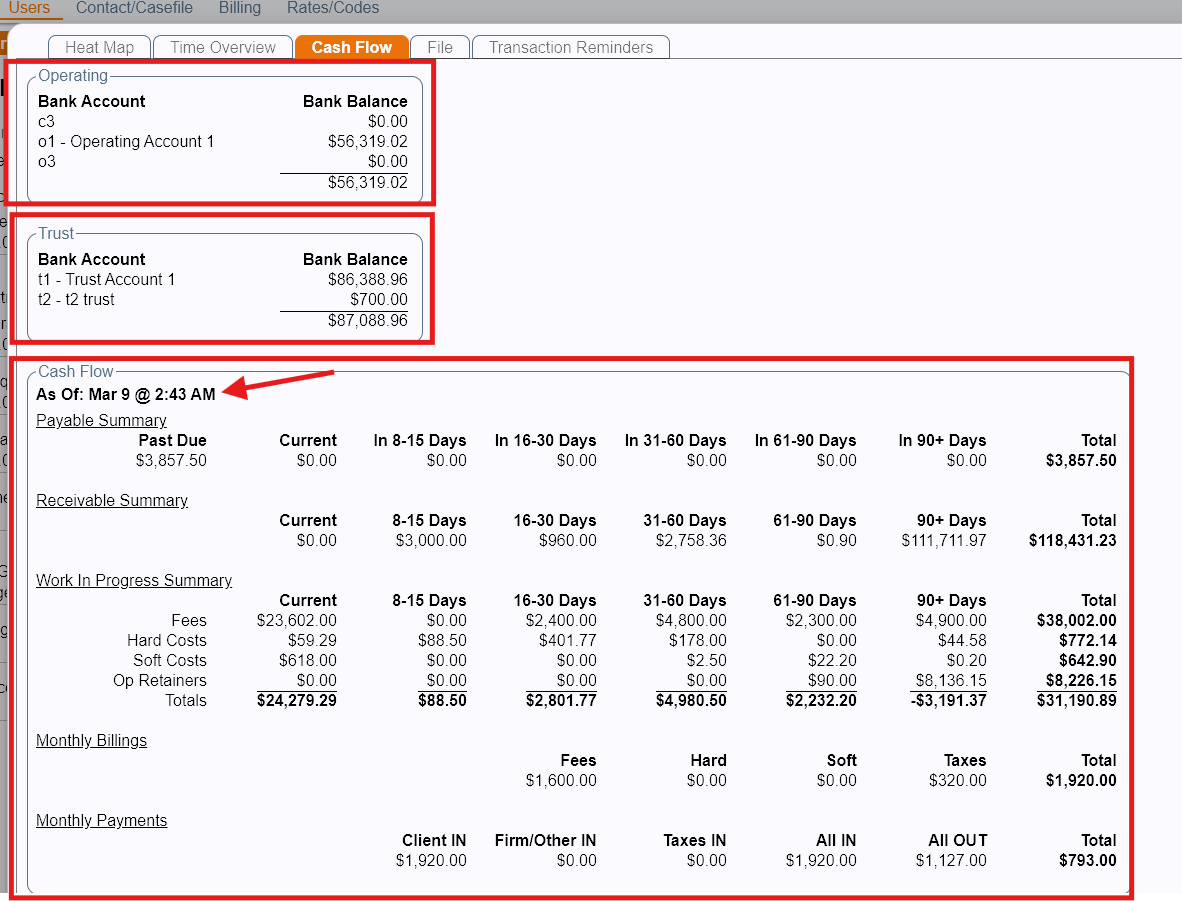
Understanding the Cash Flow Dashboard
The Cash Flow dashboard provides a snapshot of the firm’s financial position. It displays bank balances for all accounts the user has permission to view.
Information Displayed
Operating account balances
Trust account balances
Cash Flow
- Accounts Payable
- Accounts Receivable
- Work In Progress (WIP)
- Amount billed for the current month
- Payments receivedNOTE: Cash Flow does not update in real time. Data on this dashboard is refreshed automatically during the server’s nightly refresh process. If you need to update the Cash Flow dashboard immediately, you can manually refresh the data by clicking the Validate button then Refresh once done.
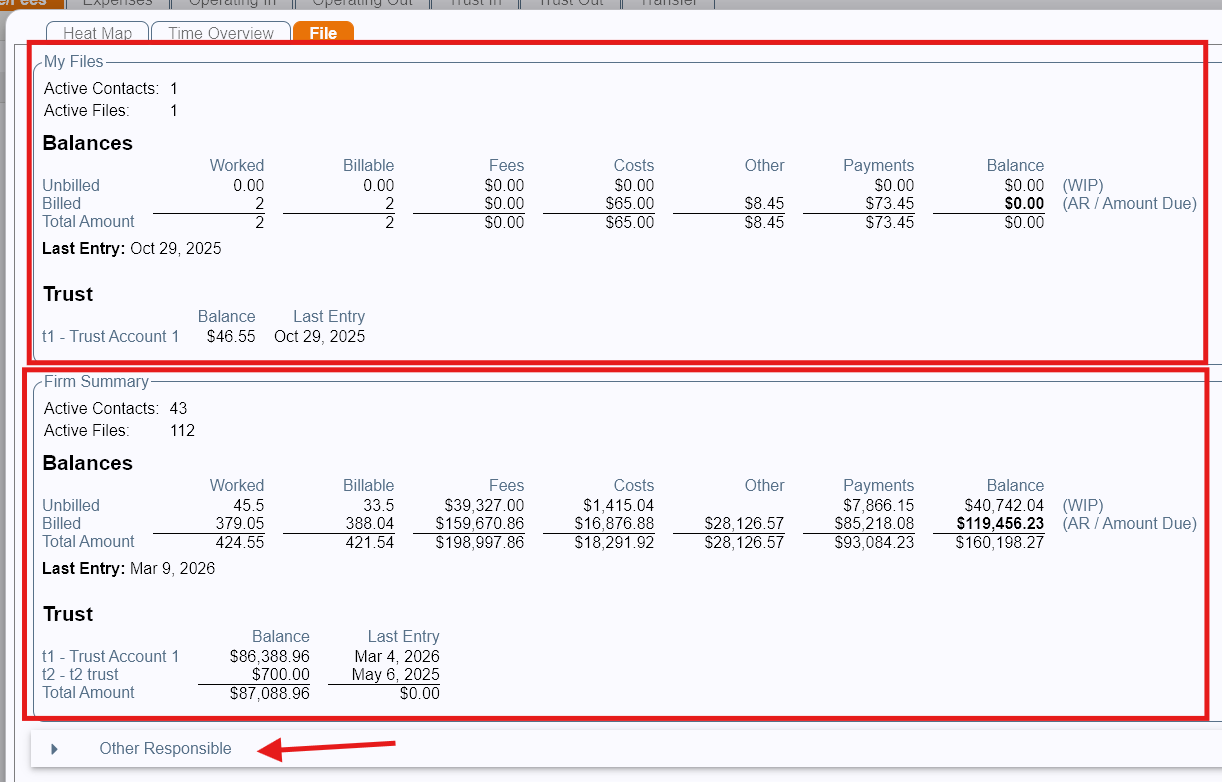
Understanding the File Dashboard
The File dashboard provides financial summaries for client files.
Information Displayed
Active Contacts and Files where the user is the Responsible Lawyer.
Balance summaries for files where the user is the Responsible Lawyer
Overall Firm summary totals
Users can expand the Other Responsible section to view financial summaries for files assigned to other users.
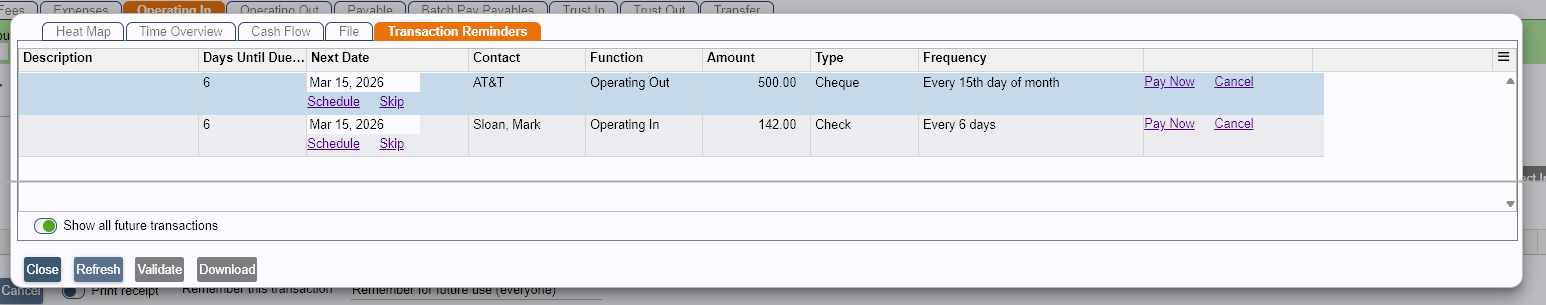
Understanding the Transaction Reminders Dashboard
The Transaction Reminders dashboard displays financial transactions that require attention.
Once reminders are configured, users can:
View reminders
Reschedule reminders
Mark transactions as paid
These actions are available by clicking the appropriate links within the reminder list.
By default, the Transaction Reminders dashboard shows only recurring (see Creating Memorized and Recurring Transactions) transactions whose reminder date has been reached or passed. You can enable the toggle Show all future transactions to view all upcoming future transactions.
Allowing or Limiting User Access to Dashboards
Administrators can control which dashboards users can access by modifying security group permissions.
To modify Dashboards access, please follow these steps:
Go to Admin > Users > Security tab.
Expand the Dashboards section.
Select the user group whose dashboard access you want to modify.
Enable Assign Permissions to Group.
Toggle On or Off the dashboards you want to change access for.
Click Save.
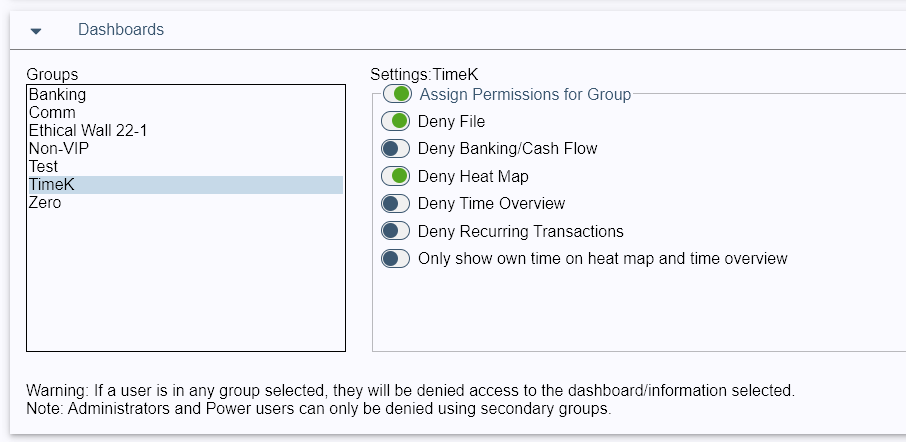
Changes will apply to all users within the selected group.
Was this article helpful?
That’s Great!
Thank you for your feedback
Sorry! We couldn't be helpful
Thank you for your feedback
Feedback sent
We appreciate your effort and will try to fix the article